Tool dossier

Chartbrew

A powerful, open-source platform for building interactive dashboards and charts from multiple data sources without coding.

3 sources 3,689 stars Self-hosted MIT

Product snapshot

How the interface presents itself

Chartbrew interface screenshot

Positioning

What this project is really offering

The goal here is to separate raw catalog facts from the sharper product shape users care about before they commit time.

About

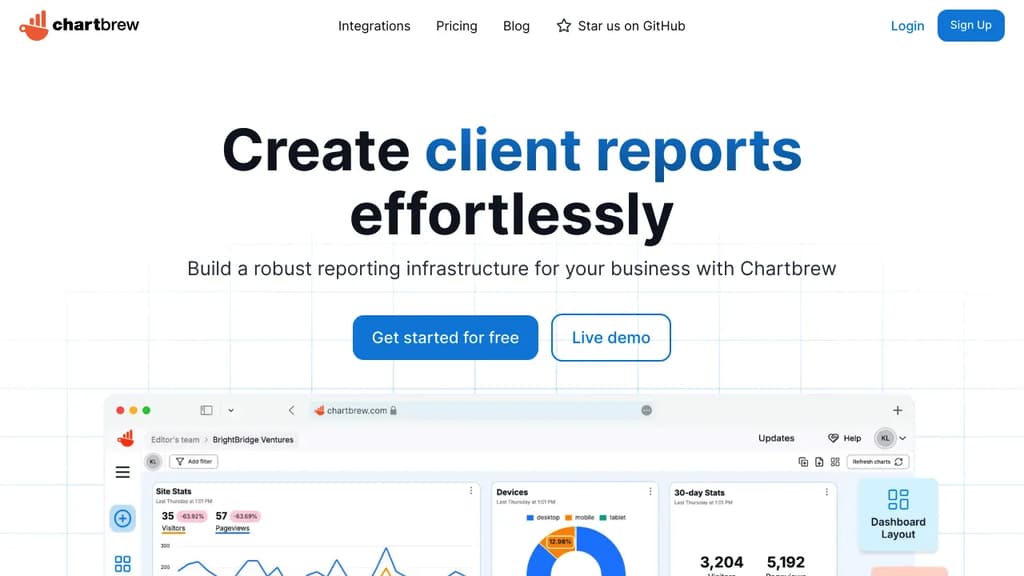
Chartbrew is an open-source web application that can connect directly to databases and APIs and use the data to create beautiful charts. It features a chart builder, editable dashboards, embeddable charts, query & requests editor, and team capabilities. You can quickly create dashboards for your clients and your team with the help of custom templates that you can create within the platform. It currently supports multiple data sources and new ones are constantly released. (MongoDB, PostgreSQL, MySQL, REST APIs, Google Analytics, Firestore)

Highlights

The capabilities most worth remembering

01

Intuitive Interface

02

Multiple Data Sources

03

Real-time Updates

04

Customization Options

05

Team Collaboration

06

Responsive Design

07

Open-source Flexibility

Evidence

What backs up the editorial summary